Tianyi Sensor IOT Technology Co., Ltd
Sales Manager:Ms. Emily Wang
Cel,Whatsapp,Wechat:+86 15898932201
Email:info@fengtutec.com
Add:No. 155 Optoelectronic Industry Accelerator, Gaoxin District, Weifang, Shandong, China


Sales Manager:Ms. Emily Wang
Cel,Whatsapp,Wechat:+86 15898932201
Email:info@fengtutec.com
Add:No. 155 Optoelectronic Industry Accelerator, Gaoxin District, Weifang, Shandong, China
Model:FT-NQ10
Brand:tianyi
1.Introduction to Farmland Weather Station
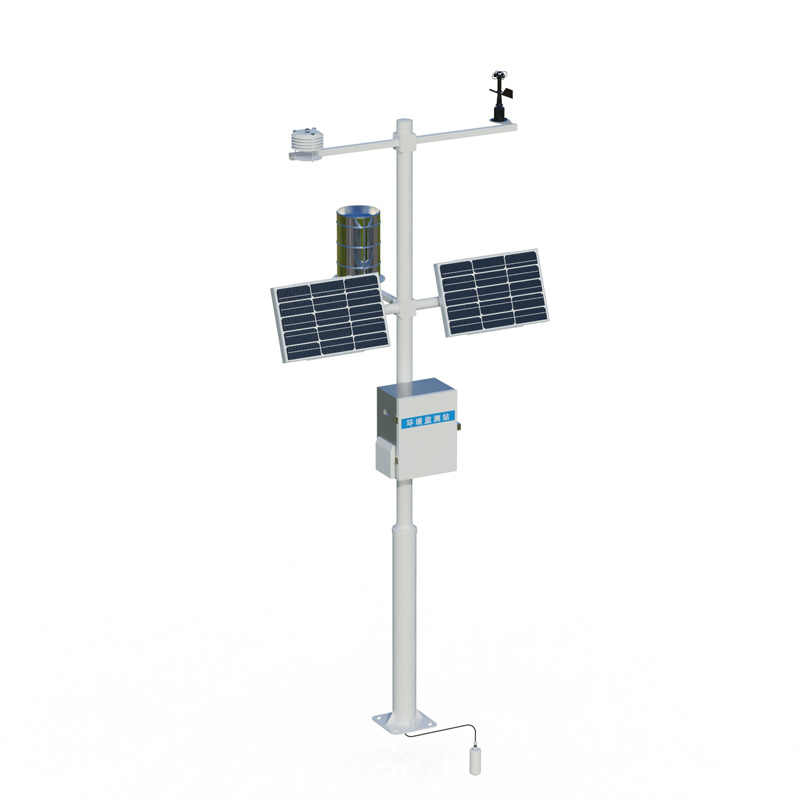
Farmland Weather Station is a weather station designed for farm environments. It uses intelligent weather station components and is very suitable for farm and agricultural monitoring needs.NQ10 Farmland Weather Station is a highly integrated, low-power, fast installation and easy for field monitoring.
The device consists of five parts: meteorological sensor, collector, solar power supply system, pole support, and cloud platform.It is free of debugging and can be quickly arranged, and is widely used in meteorological, agriculture, forestry, scientific investigation and other fields.
2.Features of Farmland Weather Station
1.Low-power collector: static power consumption is less than 50uA
2.Standard GPRS networking, support extended Bluetooth, and wired transmission
3.Seven-inch Android touch screen, version: 4.4.2, quad-core Cortex™-A7, 512M/4G
4.Support modbus485 sensor expansion
5.Solar charging management MPPT automatic power point tracking
6.Three-meter carbon steel bracket, two threaded screw connection
7.Send SMS alarm, send SMS to the specified mobile phone after exceeding the limit
8.Stainless steel protective box, corrosion-resistant and oxidation-resistant, waterproof grade IP66
3.Technical parameters of Farmland Weather Station
1.Collector power supply interface: GX-12-3P plug, input voltage 5V, with RS232 output Json data format, collector power supply: DC5V±0.5V peak current 1A,
2.Sensor modbus, 485 interface: GX-12-4P plug, output power supply voltage 12V/1A, device configuration interface: GX-12-4P plug, input voltage 5V
3.Solar power supply and equipped with lead-acid batteries, optional 30W 20AH/50W 20AH/100W 100AH.Charging controller: 150W, MPPT automatic power point tracking, efficiency is increased by 20%.
4.Data upload interval: 1 minute-1000 minutes adjustable
5.Screen size: 1024*600 RGB LCD
6.Some sensor parameters
| name | Measurement range | Resolution | Accuracy |
| Ambient temperature | -40~+80℃ | 0.01℃ | ±0.3℃ (25℃) |
| Relative humidity | 0~100%RH | 0.01%RH | ±3%RH (20%~80%) |
| Light intensity | 0-157286LUX | 1Lux | <±3% |
| Atmospheric pressure | 300-1100hpa | 0.1hPa | ±0.25% |
| Dew point temperature | 0~+70℃ | 0.1℃ | ±1℃ |
| Tube soil temperature | -30~+70℃ | 0.01℃ | ±0.3 (-10~70℃) |
| Tube soil moisture | 0~100% | 0.1% | ±3% |
| Tube Soil Salt | 0~20000us/cm | 1us/cm | ±3 (0~10000us/cm) ±5% (full range) |
| Soil PH (electrode method) | 0-14PH | 0.01 | ±0.1PH |
| Soil nitrogen, phosphorus and potassium | 0~1999mg/kg | 1mg/kg | ±2% |
| Soil evaporation | 0~75mm | 0.1mm | ±1% |
| wind direction | 0~360° (8 directions) | 1/8 | <3°(>1.0m/s) |
| Wind speed | 0~30m/s | 0.1m/s | ±(0.2+0.03V) m/s (25℃, V indicates wind speed) |
| rainfall | ≦4mm/min | 0.2mm | ≤±2% |
| Ultraviolet radiation | 0~500W/㎡ | 0.01W/㎡ | ≤±3% |
| Sunshine hours | 0~6500h | 0.1h | <0.2h |
| Total photoelectric radiation | 0-2000W/m2 | 1W/m2 | <±3% |
| Photosynthetic effective radiation | 0-2000W/m2 | 1W/m2 | ≤±5% |
| carbon dioxide | 400-5000ppM | 1ppM | ±(50ppm+5% reading |
| PM2.5 | 0-1000ug/m³ | 1ug/m³ | ±10% (<500 micrograms) |
| PM10 | 0-1000ug/m³ | 1ug/m³ | ±10% (<500 micrograms) |
| Carbon monoxide | 0-1000ppm | 1PPM | ±2PPM |
| Sulfur dioxide | 0-20PPM | 0.1PPM | ±1PPM |
| Nitrogen dioxide | 0-20PPM | 0.1PPM | ±1PPM |
| ozone | 0-20PPM | 0.1PPM | ±1PPM |
| Negative oxygen ions | 0~100,000 units/cm3 | 1/cm3 | Reading ±10%; ion mobility ≤±20% |
| Oxygen content | 0~25%Vol | 0.1% | ±3%FS |
4.Farmland Weather Station Cloud Platform
1.CS architecture software platform, supports direct observation of mobile phones and PC browsers without additional software installation.
2.Support multiple accounts and multiple devices to log in
3.Support real-time data display and historical data display dashboard
4.Cloud server and cloud data storage are stable and reliable, easy to expand, and load balancing.
5.Support SMS alarm and threshold settings
6.Support map display and viewing device information.
7.Support data curve analysis
8.Support data export table form
9.Supports data forwarding, HJ-212 protocol, TCP forwarding, http protocol, etc.
10.Support data post-processing function
11.Support external running of javascript scripts
With the vigorous development of smart agriculture, the four aspects of agricultural condition monitoring have become a key driver in advancing the modernization of agriculture. So, what exactly are these four aspects of agricultural condition monitoring in smart agriculture? In fact, they include s...
People have been measuring the wind for a long time, and the tools for wind measurement have been constantly upgraded. In the 15th century, Leonardo da Vinci designed a vane anemometer, marking the beginning of the era of scientific wind measurement. In 1846, Thomas Romney Robinson, a British naval...
Traditional weather stations mostly use mechanical devices such as wind speed and direction indicators to measure meteorological elements. These devices have some limitations. For example, mechanical components are prone to wear and icing, requiring regular maintenance and calibration. Moreover, the...
The traditional meteorological monitoring stations have limited distribution, making it difficult to comprehensively and real-timely grasp the complex and changeable meteorological conditions. However, combining drones with meteorological instruments has unexpectedly become a solution to make up for...


 Get a Free Quote
 Skype
Skype
 whatsapp
 mail
mail