Tianyi Sensor IOT Technology Co., Ltd
Sales Manager:Ms. Emily Wang
Cel,Whatsapp,Wechat:+86 15898932201
Email:info@fengtutec.com
Add:No. 155 Optoelectronic Industry Accelerator, Gaoxin District, Weifang, Shandong, China


Sales Manager:Ms. Emily Wang
Cel,Whatsapp,Wechat:+86 15898932201
Email:info@fengtutec.com
Add:No. 155 Optoelectronic Industry Accelerator, Gaoxin District, Weifang, Shandong, China
Model:FT-NQ14
Brand:tianyi
1.Introduction to the Agricultural Environment Monitoring System
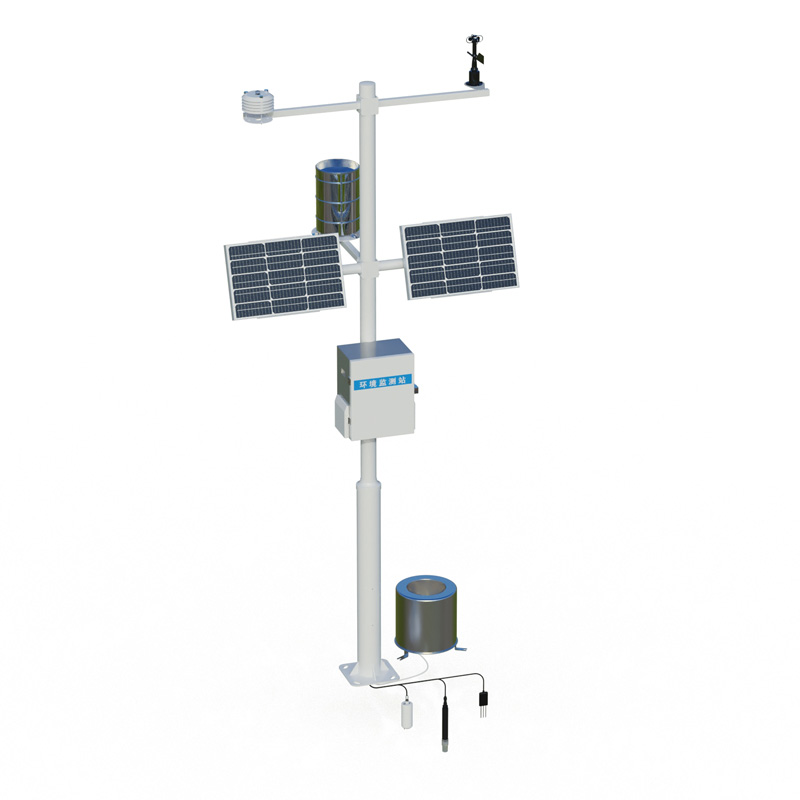
Agricultural Environment Monitoring System provides smart farm monitoring solutions for real-time or regular monitoring and evaluation of environmental factors in agricultural production.NQ14 Agricultural Environment Monitoring System is a highly integrated, low-power, fast installation and easy for field monitoring.
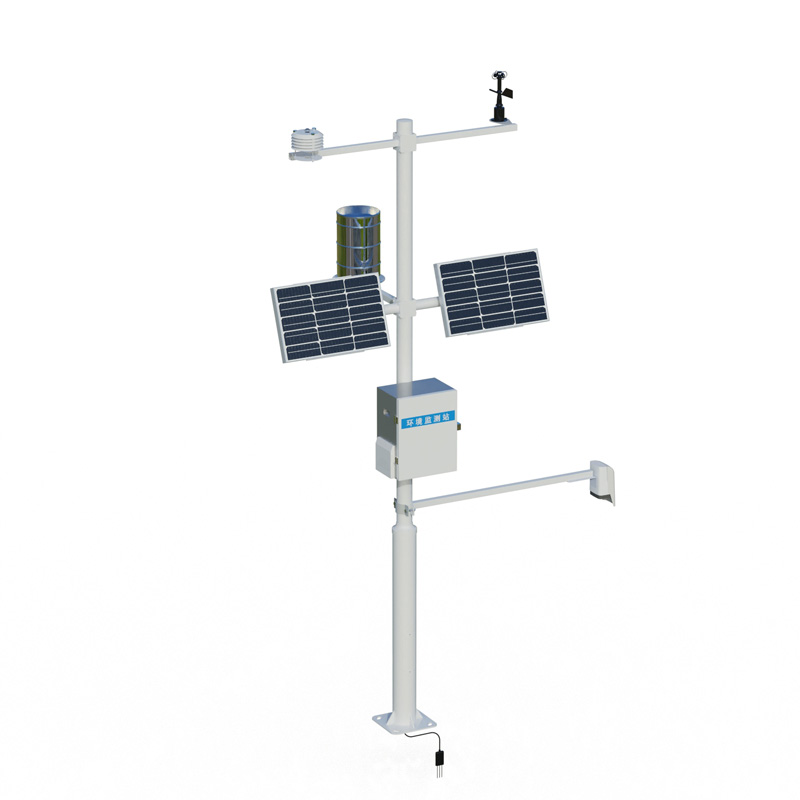
The device consists of five parts: meteorological sensor, collector, solar power supply system, pole support, and cloud platform.It is free of debugging and can be quickly arranged, and is widely used in meteorological, agriculture, forestry, scientific investigation and other fields.
2.Product features of Agricultural Environment Monitoring System
1.Low-power collector: static power consumption is less than 1mA
2.Standard GPRS networking, support extended Bluetooth, and wired transmission
3.Seven-inch Android touch screen, version: 4.4.2, quad-core Cortex™-A7, 512M/4G
4.Support modbus485 sensor expansion
5.Solar charging management MPPT automatic power point tracking
6.Three-meter carbon steel bracket, two threaded screw connection
7.Send SMS alarm, send SMS to the specified mobile phone after exceeding the limit
8.Stainless steel protective box, corrosion-resistant and oxidation-resistant, waterproof grade IP66
3.Technical parameters of Agricultural Environment Monitoring System
1.Collector power supply interface: GX-12-4P, input voltage 8-16V, with RS485 output json data format
2.Sensor modbus, 485 interface: GX-12-4P plug, output power supply voltage 12V/1A, device configuration interface: GX-12-4P plug, input voltage 5V
3.Solar power supply and equipped with lead-acid batteries, optional 30W 20AH/50W 20AH/100W 100AH.Charging controller: 150W, MPPT automatic power point tracking, efficiency is increased by 20%.
4.Data upload interval: 1 minute-1000 minutes adjustable
5.Screen size: 1024*600 RGB LCD
6.Some sensor parameters
| name | Measurement range | Resolution | Accuracy |
| Ambient temperature | -40~+80℃ | 0.01℃ | ±0.3℃ (25℃) |
| Relative humidity | 0~100%RH | 0.01%RH | ±3%RH (20%~80%) |
| Light intensity | 0-157286LUX | 1Lux | <±3% |
| Atmospheric pressure | 300-1100hpa | 0.1hPa | ±0.25% |
| Dew point temperature | 0~+70℃ | 0.1℃ | ±1℃ |
| Tube soil temperature | -30~+70℃ | 0.01℃ | ±0.3 (-10~70℃) |
| Tube soil moisture | 0~100% | 0.1% | ±3% |
| Tube Soil Salt | 0~20000us/cm | 1us/cm | ±3 (0~10000us/cm) ±5% (full range) |
| Soil PH (electrode method) | 0-14PH | 0.01 | ±0.1PH |
| Soil nitrogen, phosphorus and potassium | 0~1999mg/kg | 1mg/kg | ±2% |
| Soil evaporation | 0~75mm | 0.1mm | ±1% |
| wind direction | 0~360° (8 directions) | 1/8 | <3°(>1.0m/s) |
| Wind speed | 0~30m/s | 0.1m/s | ±(0.2+0.03V) m/s (25℃, V indicates wind speed) |
| rainfall | ≦4mm/min | 0.2mm | ≤±2% |
| Ultraviolet radiation | 0~500W/㎡ | 0.01W/㎡ | ≤±3% |
| Sunshine hours | 0~6500h | 0.1h | <0.2h |
| Total photoelectric radiation | 0-2000W/m2 | 1W/m2 | <±3% |
| Photosynthetic effective radiation | 0-2000W/m2 | 1W/m2 | ≤±5% |
| carbon dioxide | 400-5000ppM | 1ppM | ±(50ppm+5% reading |
| PM2.5 | 0-1000ug/m³ | 1ug/m³ | ±10% (<500 micrograms) |
| PM10 | 0-1000ug/m³ | 1ug/m³ | ±10% (<500 micrograms) |
| Carbon monoxide | 0-1000ppm | 1PPM | ±2PPM |
| Sulfur dioxide | 0-20PPM | 0.1PPM | ±1PPM |
| Nitrogen dioxide | 0-20PPM | 0.1PPM | ±1PPM |
| ozone | 0-20PPM | 0.1PPM | ±1PPM |
| Negative oxygen ions | 0~100,000 units/cm3 | 1/cm3 | Reading ±10%; ion mobility ≤±20% |
| Oxygen content | 0~25%Vol | 0.1% | ±3%FS |
4.Agricultural Environment Monitoring System Cloud Platform
1.CS architecture software platform, supports direct observation of mobile phones and PC browsers without additional software installation.
2.Support multiple accounts and multiple devices to log in
3.Support real-time data display and historical data display dashboard
4.Cloud server and cloud data storage are stable and reliable, easy to expand, and load balancing.
5.Support SMS alarm and threshold settings
6.Support map display and viewing device information.
7.Support data curve analysis
8.Support data export table form
9.Supports data forwarding, HJ-212 protocol, TCP forwarding, http protocol, etc.
10.Support data post-processing function
11.Support external running of javascript scripts
After long-term use, photovoltaic modules are prone to various defects. Issues such as microcracks and degradation can seriously affect power generation efficiency and the lifespan of the system. This is where the EL detector, a photovoltaic operation and maintenance device, comes into play. It is a...
Every flood season, heavy rainfall occurs frequently, causing water levels in rivers and lakes to rise rapidly, and the risk of flood disasters increases significantly. During such a special period, the Radar Current Meter, as a professional hydrological monitoring device, becomes an important tool...
Tianyi specializes in the research, development and production of meteorological monitoring equipment, with profound technical strength and rich experience in the field of Automatic Farmland Weather Station. The weather stations produced by the company feature high-precision sensors and are made of...
Why Does Wind Power Generation Easily Encounter Icing Issues?First, wind farms are mostly located in areas with abundant wind resources such as mountains and coastal regions, where harsh climatic conditions (high humidity, low temperatures) easily lead to weather phenomena like clouds, fog, and free...


 Get a Free Quote
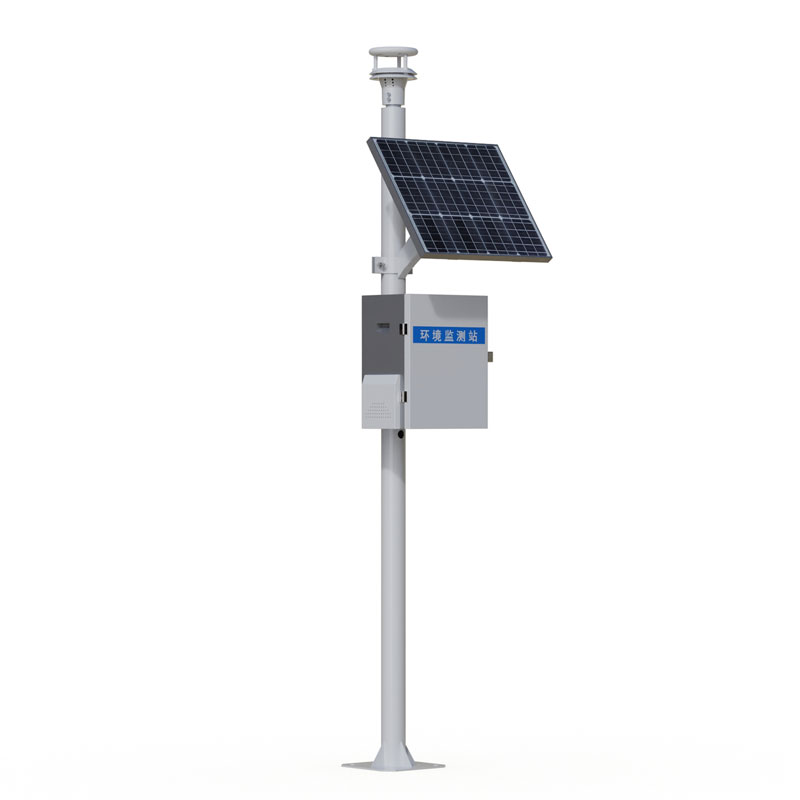
 Skype
Skype
 whatsapp
 mail
mail